How to Use Video Audit and Read Seizure Safety Results
- Your files stay local: The free analyzer runs entirely in your browser. Nothing is uploaded to a server.
- Frame-by-frame chart: The waveform tracks luminance and red saturation density across every frame, plotted as a percentage of the hazardous reference window.
- Visual grid overlays: The video player draws yellow boxes for luminance transitions and red boxes for red ratio transitions, with ▲ or ▼ arrows showing which direction each region shifted.
- Practical fixes: Most violations are resolved by adjusting frame counts, reducing the flash zone size, or easing brightness transitions. You rarely have to cut the effect entirely.
Safe content and good-looking content are not mutually exclusive. The free Video Audit tool gives you the data to tell the difference between a flash that is fine and one that is not, without sending your files anywhere.
This guide walks through each stage: uploading, configuring, reading the results, and fixing what comes up.
#Step-by-Step Tool Walkthrough
Testing your video content is simple. The local parser scans your frames, checks them against chosen safety guidelines, and pinpoints exact issues.
#1. Uploading the Video
Drag your video file into the upload box on the homepage.
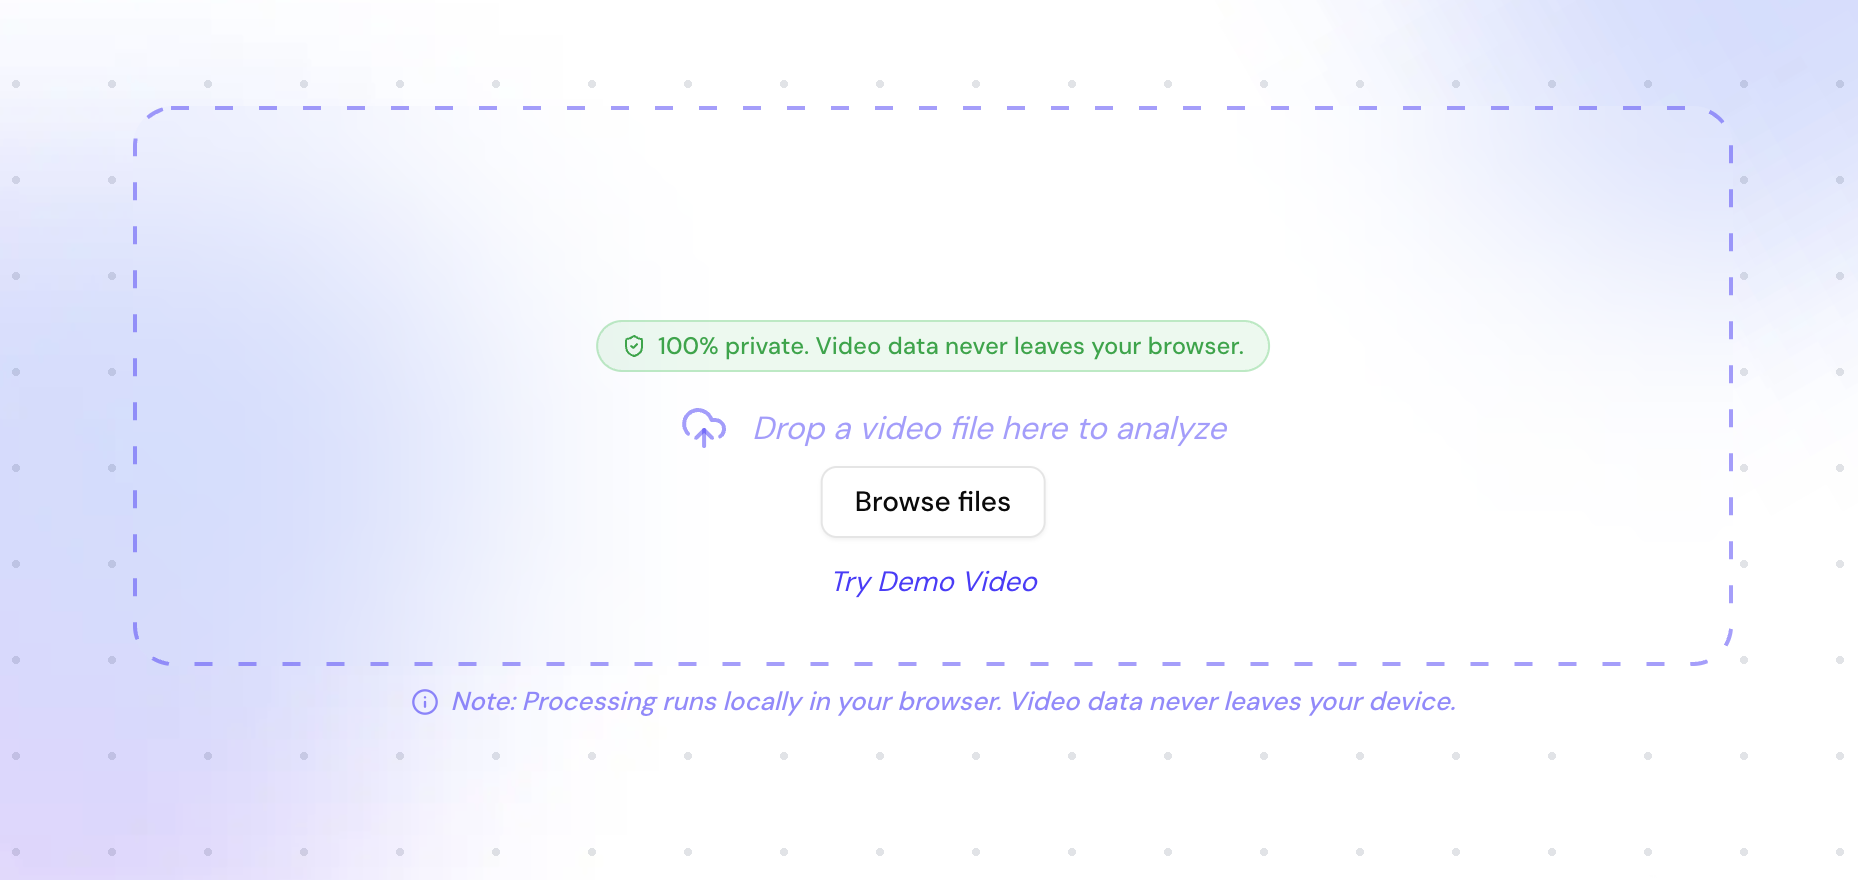 Figure 1: Clean drag-and-drop file upload box on the homepage.
Because the free tool runs directly in your browser on your device, the file remains on your local machine. It does not transfer to an external server. Once you select a file, the browser decodes its metadata, displaying characteristics like frame size, duration, frame rate, color space, and dynamic range (SDR or HDR).
#2. Adjusting the analysis settings
Before running the scan, choose which standards to check against and tune the detection settings.
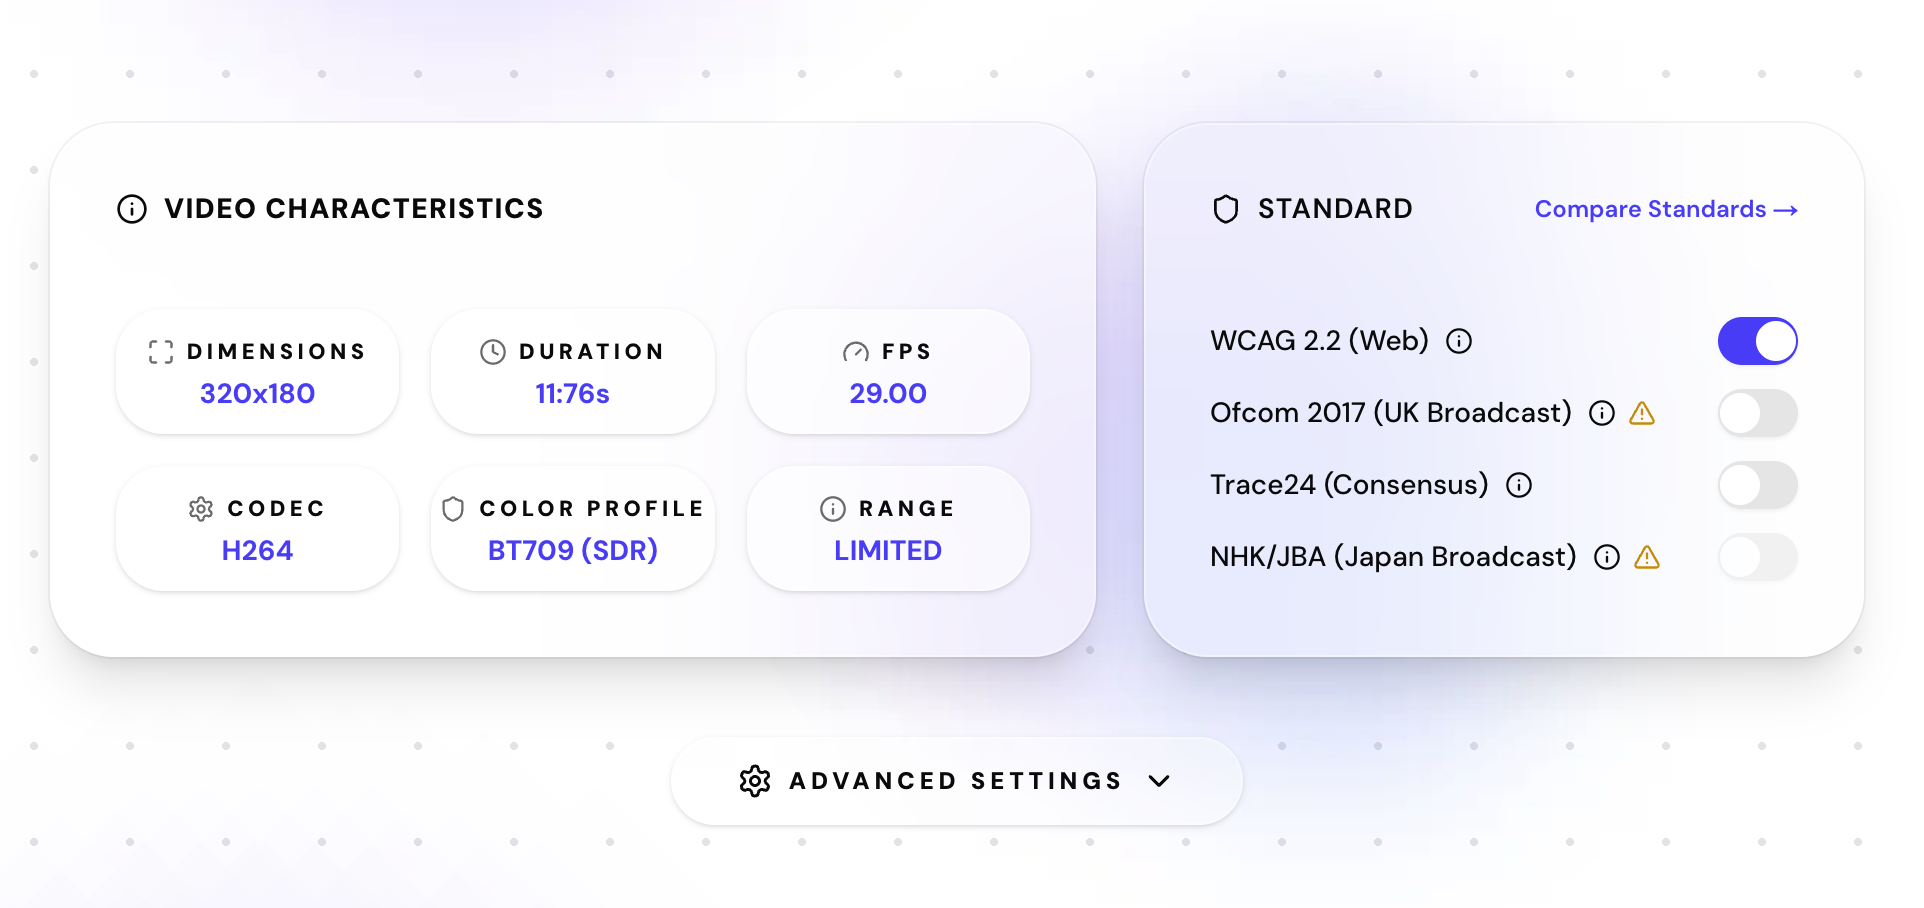 Figure 2: Settings section showing standard switches and the advanced settings drawer.
- Standard selection: Pick one or more compliance standards to audit simultaneously. Each targets a different context:
- WCAG 2.2 applies to web content (websites, web apps, YouTube, TikTok, embedded players).
- Ofcom 2017 covers UK broadcast television.
- Trace24 (Consensus) is a modern alternative to the existing standards, currently not a requirement.
- NHK / JBA applies to Japanese broadcast.
- 66ms sliding window: Turned on by default. It catches transitions that build up slowly. Under modern compliance recommendations, a luminance shift that takes longer than 66ms to reach the critical threshold is excluded.
#3. Processing and local execution
Click the main action button to start the audit. Keep the tab open while it runs.
 Figure 3: Loading progress indicator during WASM processing.
Speed depends on your machine, since every pixel is decoded and checked locally. Once the scan finishes, the results load automatically.
#4. Reading the waveform chart
The results screen shows a dual-axis timeline chart with two lines: one for luminance, one for red saturation.
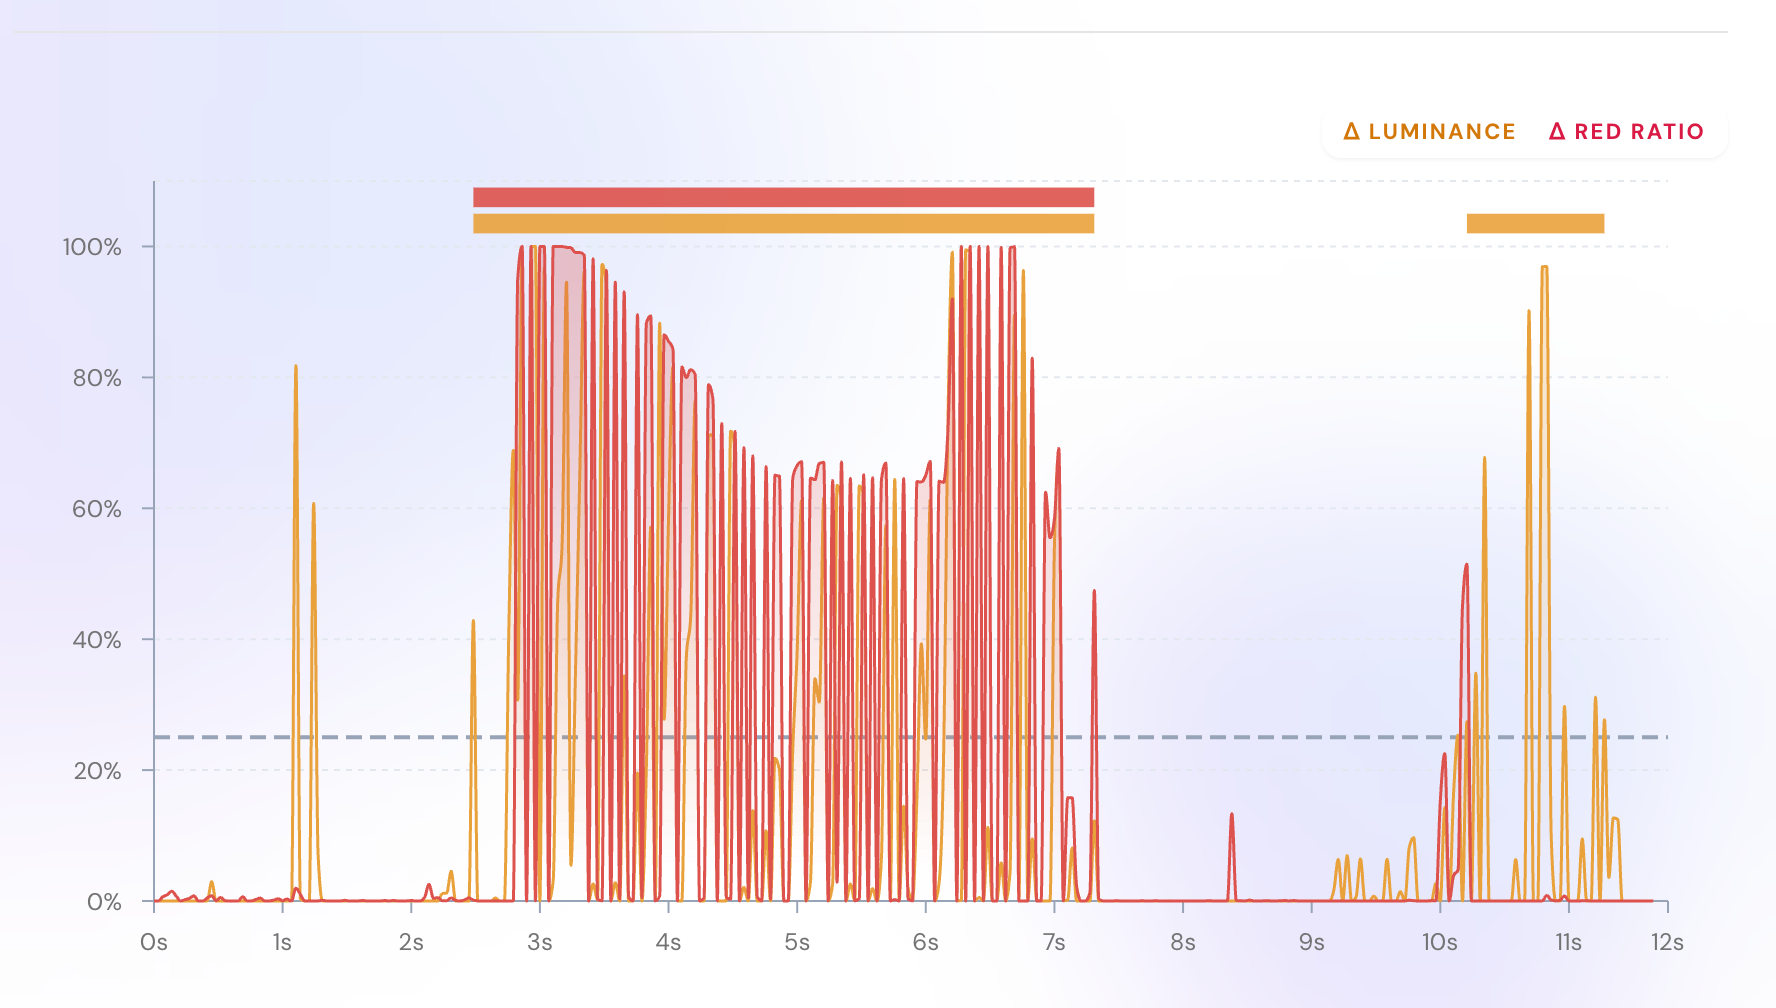 Figure 4: The timeline chart showing luminance and red saturation waves with vertical violation markers.
- Yellow line (Luminance): The worst-case percentage of pixels inside any reference subarea that crossed the luminance transition threshold in that frame.
- Red line (Red saturation): The same measurement, but for red-ratio transitions specifically: pixels shifting into or out of a saturated red state.
What the Y-axis percentage means. The chart does not track overall video brightness. It tracks hazard density per frame. The reference window (for WCAG, a subarea) slides across the frame, and the chart reports the highest percentage of pixels within any single window that crossed the threshold at that moment. Once that number hits 25%, at least a quarter of a 10-degree visual field was affected, which is the threshold at which a flash becomes potentially hazardous.
What the vertical markers mean. A colored vertical line rising above the waveform is not just one bad frame. It marks the start and the end of a complete violation sequence. The analyzer counts opposing transitions inside a rolling one-second window, and when that count exceeds three full flash cycles, it draws a vertical marker at the last frame that pushed the count over the limit. Everything between that marker and the previous one is a confirmed violation cluster.
#5. Interpreting the visual grid overlays
Pause on a failing frame and the player draws colored grid boxes over it. Each box shows where a hazardous transition occurred and which direction it went.
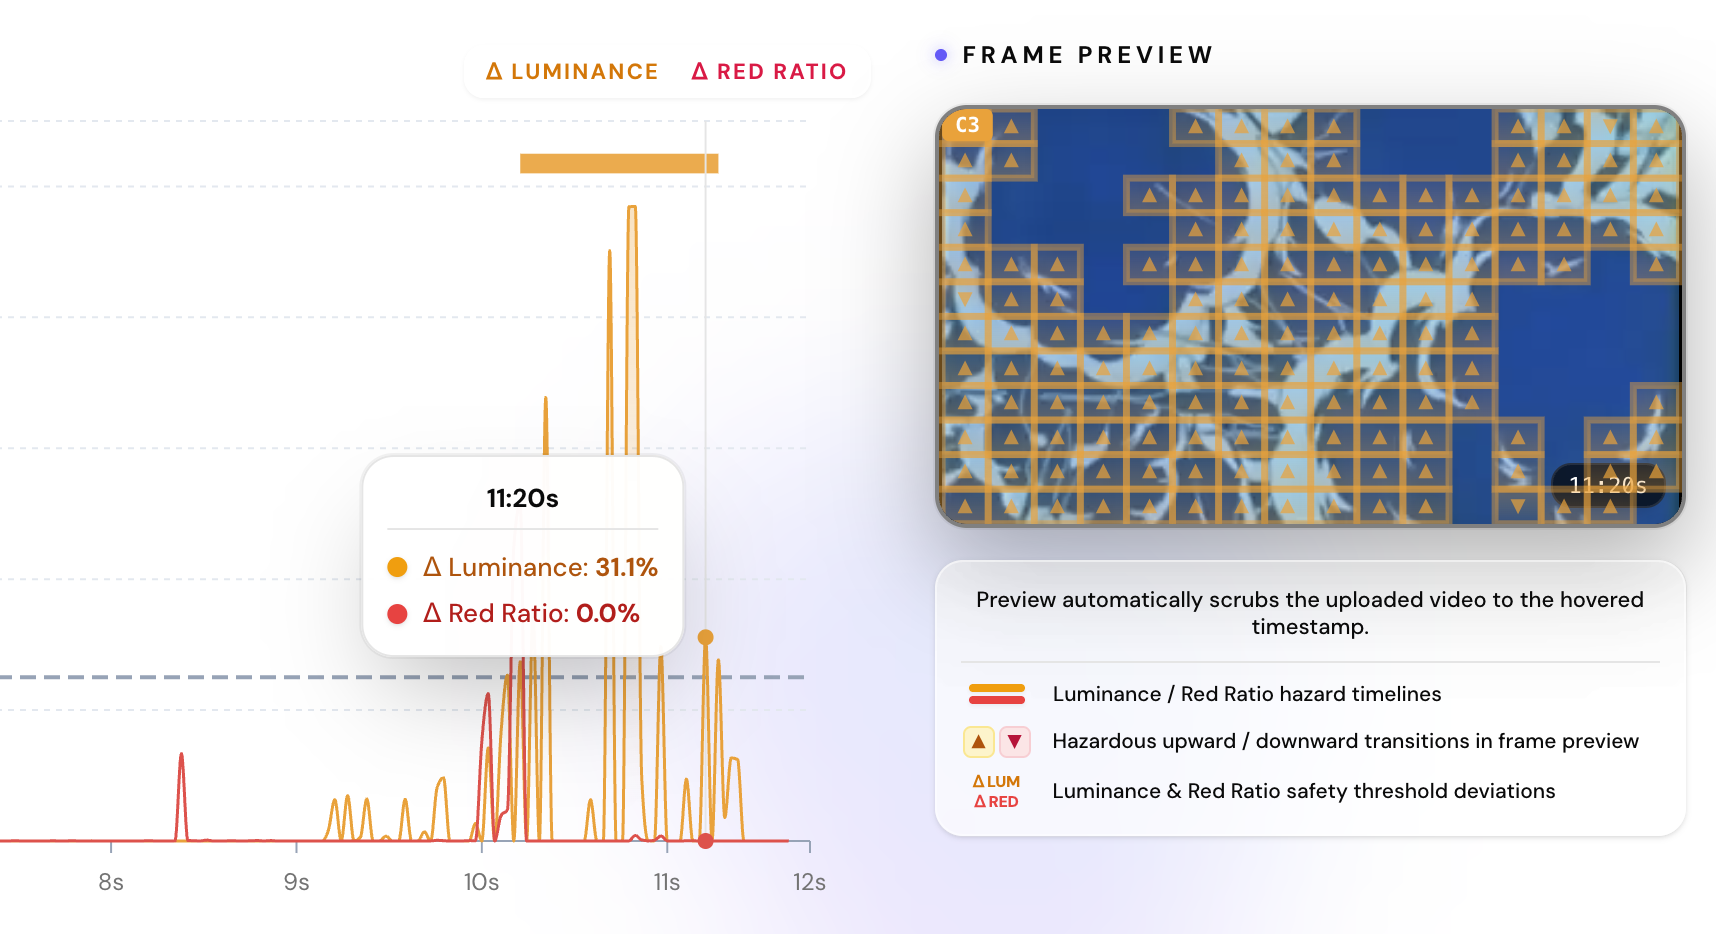 Figure 5: Violating frames showing yellow/amber and red grids with ▲ and ▼ arrows overlaid.
- Yellow boxes: Luminance transitions (an abrupt shift in brightness).
- Red boxes: Red ratio transitions (an abrupt shift in saturated red color).
- Up arrows (▲): Positive transition. Pixels in that box got brighter or shifted into a saturated red state.
- Down arrows (▼): Negative transition. Pixels got darker or dropped out of a saturated red state.
A single transition is not a problem on its own. Going from dark to light once is fine. The issue is when opposing transitions pile up in the same area: dark-to-light, then immediately light-to-dark, then dark-to-light again. When that alternation exceeds three full cycles within any one-second window, the tool logs it as a violation.
#6. Reviewing the final compliance summary
At the bottom of the page, the tool shows a pass/fail status and a detailed violations log.
 Figure 6: Compliance summary card showing pass or fail status per standard.
If your video passes all selected standards, you get a green checkmark. If not, a violations table appears below the status card.
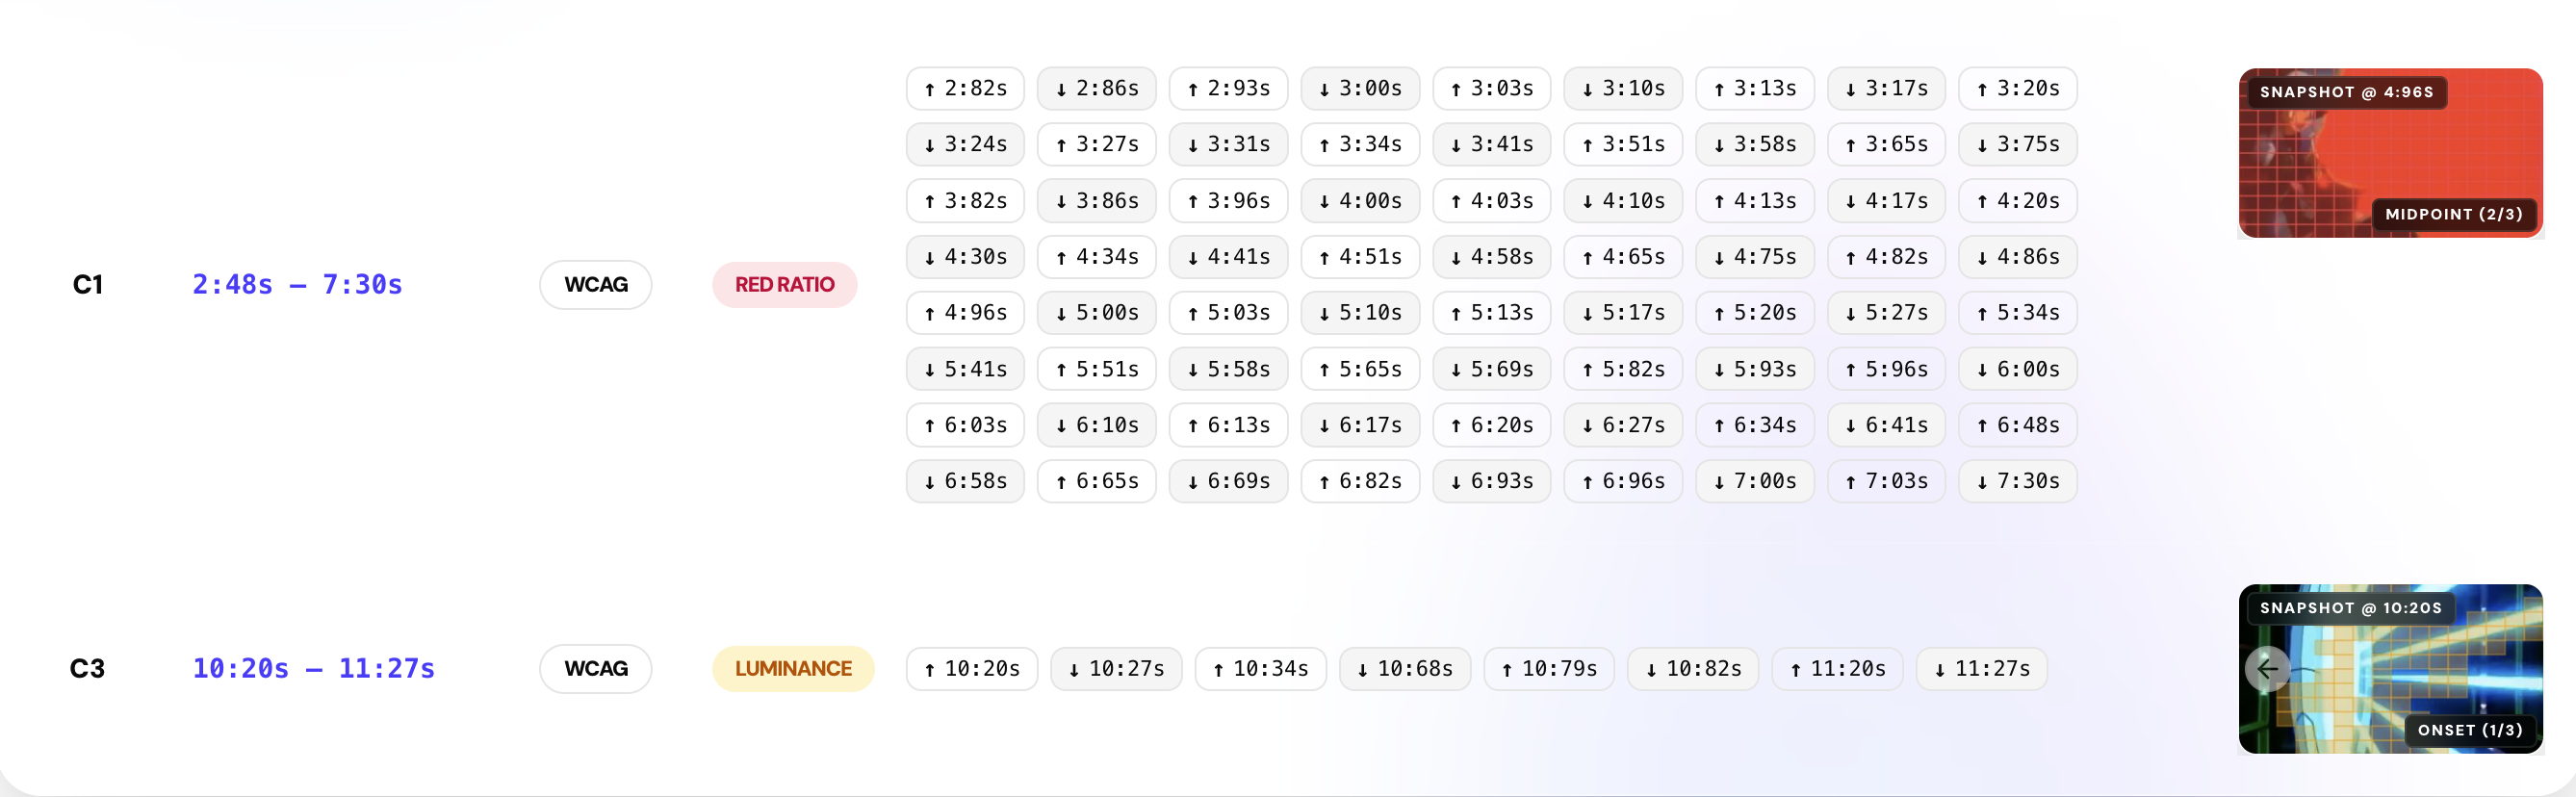 Figure 7: The detailed violations table listing every flagged cluster with full context.
Each row is one violation cluster: a confirmed sequence of hazardous flashes. Here is what each column contains:
- Cluster #: A sequential index. Five rows means five distinct hazard events.
- Time range: The start and end timestamp of the full violation window, not just the peak frame.
- Violation type: Luminance flash, red flash, or both at once.
- Timecodes with transition direction: The individual frame timestamps inside the cluster, each tagged with a direction: ↑ for a positive transition (the scene got brighter or redder) and ↓ for a negative one (darker or less saturated). Read left to right and you can see the exact strobe rhythm. For example, ↑ at 01.03 s, ↓ at 01.10 s, ↑ at 01.17 s means three opposing transitions in under a second.
- Screenshot: A frame captured from inside the violation window with the grid boxes already drawn. Yellow marks luminance transitions, red marks red-ratio transitions. Take this directly to your editor to find the shot.
#Actionable tips to prevent seizure hazards
Failing a check does not mean your content is beyond saving. Most violations come down to one of three things: too many cycles per second, too large a flash area, or too sharp a transition. Fix any of those and the numbers change.
#Reduce the contrast delta
Avoid cutting between pure white and pure black in adjacent frames. Strobe between light gray and dark gray instead. A modest contrast reduction is usually enough to drop the luminance delta below the 10% relative threshold.
#Limit the flash zone size
For effects like camera shutter pops or explosions, keep the flashing area below 25% of the 10-degree visual field. A big, full-screen flash that cycles once is more likely to fail than a smaller flash that cycles twice in the same window. Localize the effect.
#Space out the flashes
The standard counts opposing transitions: one full on-off-on cycle equals two transitions. More than three full cycles within any one-second rolling window triggers a violation. In practice, keep at least 333 ms between flash onsets.
One thing worth knowing: if your strobe runs at 65 Hz or faster (each individual flash lasting 15 ms or less), the analyzer collapses the entire burst into a single merged transition. That burst counts as only two transitions total, one at the start and one at the end. This makes extremely fast strobes paradoxically less risky than mid-rate ones in the 4 to 20 Hz range. The dangerous zone is the middle ground, not the extremes.
#Avoid alternating red and blue strobes
The eye responds particularly strongly to rapid alternation between saturated red and saturated blue. That specific color pair is among the most reliable triggers for photosensitive seizures. If the effect needs color, try desaturated reds, or shift the alternating color toward amber or yellow.
#Insert easing frames
Cutting from 0% to 100% brightness in a single frame creates the sharpest possible edge. Insert one or two intermediate frames to spread the change over time. The transition still reads as a flash visually, but the rate of change drops low enough to clear the compliance window.
#Animation remediation: Blender case studies
A Japanese animation blog, Tenp Kukan, documented how they fixed WCAG failures in Blender Grease Pencil work using the methods above.
#Case study 1: Spark and energy effects
The original clip flashed four times per second and covered more than a quarter of the screen, two simultaneous failures. They fixed it by cutting two of the flashing frames (dropping to two flashes per second) and reshaping the sparks on alternating frames so the flashing area stayed small. The effect still reads as energetic. It just no longer fails.
#Case study 2: Thunder and lightning
A lightning stroke animated between pure black and pure white in consecutive frames. The fix was straightforward: insert intermediate frames to fade the transition in and out, and lower the peak brightness on the main strike. Spread over three frames instead of one, the luminance change rate dropped well below the compliance threshold. The lightning still looks dramatic. The sharp visual trigger is gone.
#Conclusion
Photosensitive epilepsy risk is measurable. Video Audit gives you a precise read on every frame: which exact seconds are dangerous, what type of flash triggered the issue, and where on screen it originated. That is specific enough to take directly into your editor.
You will know what to fix and where to look for it.
#Frequently Asked Questions
No. The free Video Audit analyzer operates locally. All decoding and frame analysis occur right in your browser. Your media files never leave your device.